Daily Leverage Certificates
DLC Hotline: (65) 6226 2828
Market Commentary (Hong Kong)
For the week ending 04 August 2023
Dollar Index DXY resisted by 102.80; Fitch downgraded US’s credit rating to AA+. Nasdaq closed this week’s session at three weeks’ low, the first major setback since February this year.
● China to Europe freight train trips exceeded 10000 last week carrying 27 percent more goods.
● Hong Kong and Malaysia will join hands to develop an economic hub 1km from the Malaysia-Singapore border.
● China issued 20 measures to boost domestic consumption including support for real estate.
● US FDIC took over Heartland Tri-State Bank.
● China’s first homegrown 28-nm lithography machine to be delivered by the end of this year.
● Venezuela officially applied to join the BRICS.
● Tesla’s July EV-sales in China fell 31% compared to previous months while China-makers’ sales broke records.
● Saudi Arabia will cut oil production by 1 million BPD for another month till September.
● India imposed a licensing requirement for imports of laptops, tablets and personal computers with immediate effect.
Hang Seng Index closed this week at 19539, down 377 points or 1.89%. The index opened high this week as a carry over of last week’s rally. Monday euphoria quickly turned South after early movers locked in their profits. Short term moving averages are rising and price action from the previous weeks indicate that a swing low might be in place. Long term moving averages however are slow to catch on and might deliver a false signal that the index is still resisted. This week’s trading low and close could be a nod to the 10 Day SMA which indicates potential support. Should the index surpass 20000, rally could gain traction.
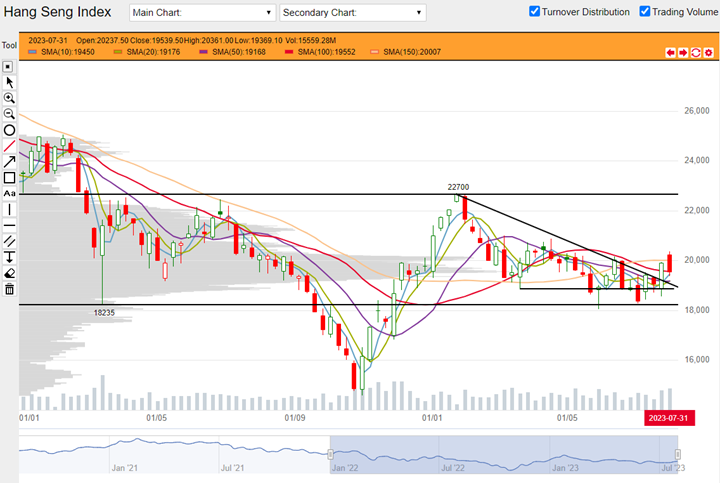
HSI weekly chart from 03 January 2022 to 04 August 2023 (Source: DLC.socgen.com)
Hang Seng Tech closed the week at 4497, up 31 points or 0.69%. Despite the bearish performance, HSTech scored a gain by managing to close higher than last week. This is also an indication that there is more relative strength compared to the HSI. HSTech is trading above its entire basket of moving averages. This is a setup associated with further gains. Based on two previous swing highs, potential resistance could show up between 4800 to 5000.
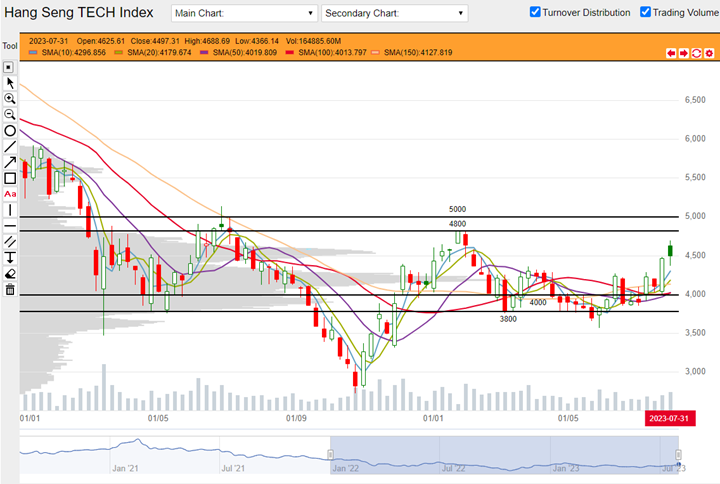
HSTech weekly chart from 03 January 2022 to 04 August 2023 (Source: DLC.socgen.com)
Dow Jones Industrial Average closed at 35066, down 394 points or 1.11%. Nasdaq closed at 15275, down 476 points or 3.02%. This week we see Nasdaq’s softest performance so far since February this year with an end-of-week close at 3-week low. Both Nasdaq and the Dow printed bearish engulfing candlestick patterns which might indicate a potential swing high. There might or might not be retracement as moving averages are still set up for further gains. Market could be cautious however as bearish engulfing candles mean that the current tops could be read as potential resistance in coming weeks.
The next FOMC meeting is scheduled on 20 September 2023.
Fed funds futures on rate hike probability by next Fed meeting as at this week’s close:
● 87.5% probability of no change | 12.5% probability of 25 basis points hike
Fed funds futures on rate hike probability by next Fed meeting based on last week’s close:
● 80.0% probability of no change | 20.0% probability of 25 basis points hike
Data indicates a peak rate of 6.00% until March 2024. A rate cut could appear as early as December.
Shanghai Composite closed at 3288, up 12 points or 0.37%. Shenzhen closed at 11238, up 138 points or 1.24%. Both indices were tentative but managed to close higher than previous week. Moving averages indicate that Shanghai could be set up for further gains. Shenzhen is still potentially resisted by its falling 100 and 150 Day SMAs.
Economic data in coming week:
1. Tuesday 08 August 2023 China reports import-export numbers.
2. Wednesday 09 August 2023 China reports CPI and PPI mom and yoy numbers.
3. Thursday 10 August 2023 US reports CPI mom and yoy and Unemployment Claims.
4. Friday 11 August 2023 UK reports GDP mom.
5. Friday 11 August 2023 US reports PPI mom and Prelim UoM Consumer Sentiment.
Other news:
● BYD informed its JV partner in India that it wishes to terminate EV car investment after interference from New Delhi.
● Indian authorities investigate BYD for tax practices.
● Tencent began testing its own AI model and is integrating it into several products and services.
Technical observations
Kuaishou 1024.hk inverted head and shoulders chart pattern, part of bigger pattern.
Note chart features:
1. Kuaishou broke above $60 last week. There is an inverted head and shoulders reversal pattern that was formed over six months below $60, which $60 being the key resistance or neckline of this pattern. $60 was broken so this pattern indicates that Kuaishou printed a bullish reversal. Note that this bullish reversal was accompanied by rising volume. Price is also trading above its entire basket of moving averages. This is a setup associated with further gains and the whole combination of indicators and volume vindicates and reinforces the pattern.
2. There is a downward sloping resistance zone connecting multiple swing tops, going back to November 2021. This zone spans over a long duration and so should be quite significant. It could be a strong potential resistance but if broken, could also attract bullish entrants into this stock.
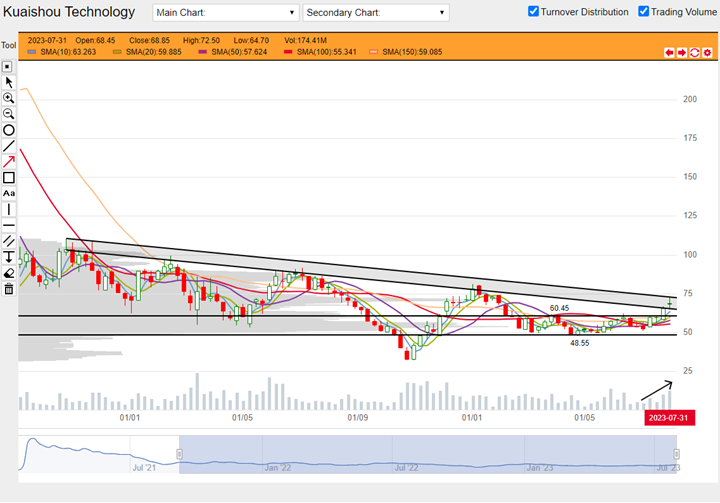
Kuaishou 1024.hk weekly chart from 06 September 2021 to 04 August 2023 (Source: DLC.socgen.com)
Underlying Index/Stock |
Underlying Chg (%)1 |
Long DLC (Bid Change%2) |
Short DLC (Bid Change%2) |
|---|---|---|---|
| Hang Seng Index (HSI) | +0.40% | B00W (+0.86%) | VXRW (-0.35%) |
| Hang Seng TECH Index (HSTECH) | -0.93% | YPCW (-6.25%) | Y9GW (+2.07%) |
| Kuaishou Technology (1024.HK) | -2.35% | VLLW (-11.11%) | XN7W (+11.11%) |
Brought to you by SG DLC Team
This advertisement has not been reviewed by the Monetary Authority of Singapore. This advertisement is distributed by Société Générale, Singapore Branch. This advertisement does not form part of any offer or invitation to buy or sell any daily leverage certificates (the “DLCs”), and nothing herein should be considered as financial advice or recommendation. The price may rise and fall in value rapidly and holders may lose all of their investment. Any past performance is not indicative of future performance. Investments in DLCs carry significant risks, please see dlc.socgen.com for further information and relevant risks. The DLCs are for specified investment products (SIP) qualified investors only.
Full Disclaimer - here